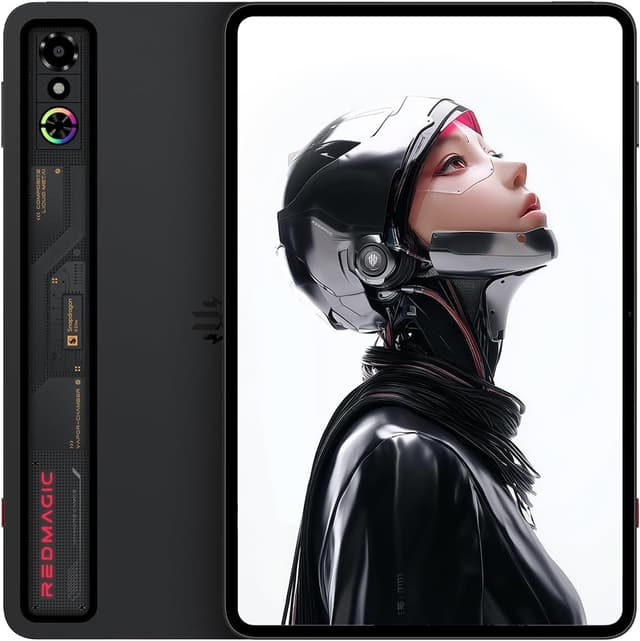
Best price-to-performance with Snapdragon 8 Elite—fastest Android chip. Outperforms iPad Air M2 in gaming at half the price. 90fps Fortnite vs 60fps on Samsung tablets.
Snapdragon 8 Elite fastest Android50% faster than Samsung tablets144Hz displayLCD not OLEDNo stylus included
Only Windows gaming tablet with AMD Ryzen Z2 Extreme. Run Steam, Epic, Game Pass natively. 180Hz display, full desktop Adobe apps—no mobile compromises.
True PC gaming on tablet180Hz smoothest displayFull Windows 11~1 hour gaming battery780g heavy
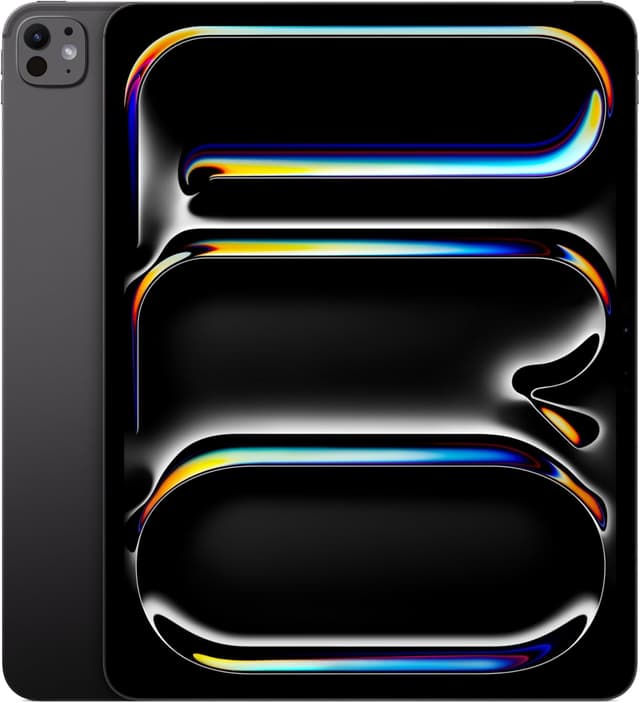
The first decision isn't which chip benchmarks highest — it's which operating system actually runs the software you need. iPadOS, Android, and Windows all now field genuinely fast silicon, but they diverge sharply on what a top score translates into. Apple's M5 in the iPad Pro posts the best sustained numbers of any tablet chip and edits 4K ProRes without breaking a sweat, but that horsepower is gated behind iPadOS's app model, which still can't run desktop-class creative suites the way a full OS can. The RedMagic Astra is the outlier here: its AMD Ryzen Z2 Extreme runs actual Windows, so Steam, Epic, Game Pass, and desktop Adobe apps work exactly as they would on a laptop — the tradeoff is battery life and a chunkier chassis to house the extra cooling that x86 performance demands. Android tablets like the OnePlus Pad 3 close the gaming gap on raw frame rates but remain bound by mobile app ports rather than native desktop software. Match the OS to the actual task before comparing specs. Thermal design is the second thing benchmarks hide: a tablet with no fan will throttle under sustained load, so a chip that tops a short synthetic benchmark can still fall behind a better-cooled rival during a 30-minute render or a long gaming session — look for sustained-performance test results, not just peak scores, and treat any fanless flagship's advertised numbers as a best-case ceiling. RAM matters more than most buyers assume: 8GB is fine for browsing and note-taking, but multitasking with several creative or Android-emulation apps open benefits noticeably from 12-16GB, and unlike a laptop, tablet RAM is never upgradeable after purchase — buy for the workload two years out, not today's. The most common mistake in this category is chasing the highest CPU/GPU spec sheet number without checking software compatibility first: a tablet that wins every benchmark is a bad purchase if it can't run the specific creative suite, game launcher, or professional tool the buyer actually needs day to day.
Performance rankings based on published benchmark scores (Geekbench, 3DMark), real-world workload results from independent reviewers, sustained performance under load, and value proposition.
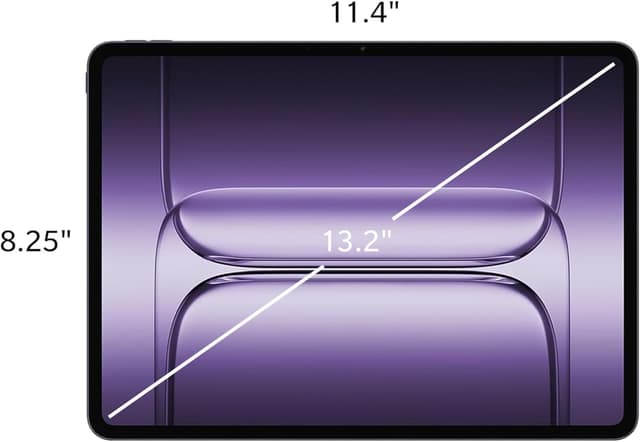
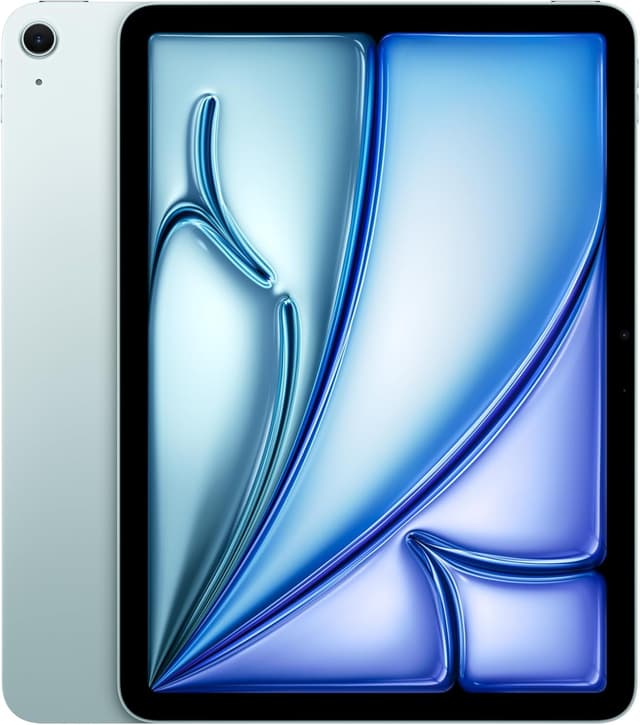
For most users, yes. iPad Air M3 handles 95% of tasks identically at $400 less. M5 justified for professional video editing, 3D work, and demanding creative workflows.
Best gaming tablet?
For mobile games: OnePlus Pad 3 with 144Hz and 90fps Fortnite. For PC games: REDMAGIC Astra runs Steam/Epic natively but has ~1 hour gaming battery.